
Housing Softens, Fed Signals a Cut: What This Means for Practice Loans, Real Estate & Your Portfolio (Oct 19–26, 2025)
The weekly churn of market data can feel like noise. But for a physician, certain signals directly impact the large-capital decisions that define a career: buying a practice, financing an imaging center, or purchasing the building you operate from.
This week’s numbers on housing, inflation, and federal debt aren’t abstract. They provide a read on the cost of capital and the direction of asset prices. Understanding these inputs is the first step in modeling a major financial commitment, whether for your practice or your personal portfolio.
📌 Key Takeaways
-
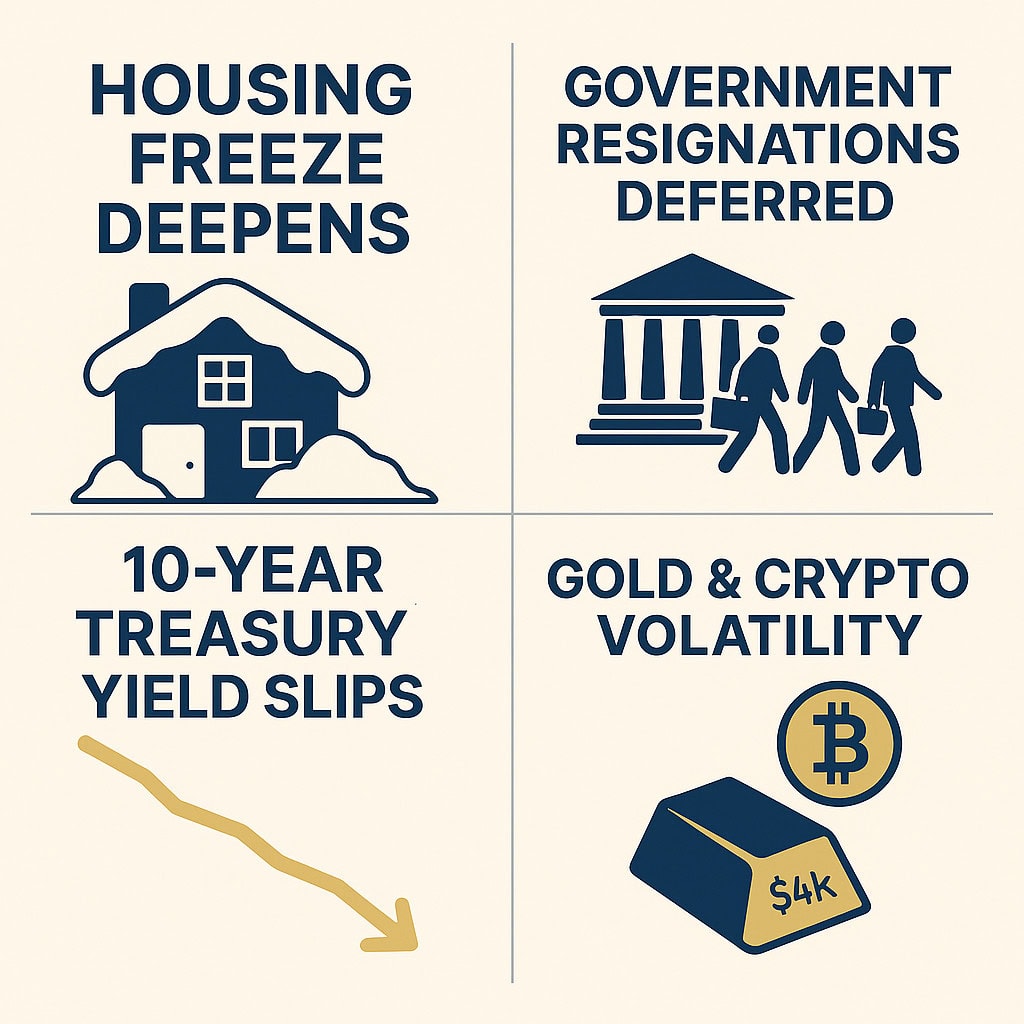
Housing still weak: Existing‑home sales rose slightly but are still 23 % below 2019 and supply remains at 2016 levels wolfstreet.com.
-
Biggest price drops: Mid‑tier single‑family home prices have fallen 10–24 % from their peaks in 15 large metros; condo prices in 23 cities are down 12–28 %.
-
OER outlier: A major statistical anomaly in Owner’s Equivalent of Rent (26 % of CPI) suppressed inflation data, but headline CPI still rose 0.31 % MoM.
-
Food inflation pockets: Beef prices jumped 14.7 % YoY; eggs are still 146 % above mid‑2020 levels.
-
Debt milestone: U.S. Treasury debt hit $38 trillion, rising $1.8 trillion since July.
-
Gold & crypto: Gold briefly topped $4.18 k/oz; Bitcoin trades around $115 k. Regulatory headwinds and safe‑haven demand continue.
-
What’s next? Markets expect a 25‑bp Fed rate cut and end of balance‑sheet runoff calculatedriskblog.com; watch for October jobs data showing deferred federal resignations.
🏠 Housing: Sales Tick Up, Prices Slide
Existing‑home sales edged higher in September but remain far below pre‑pandemic levels. Single‑family sales were 23 % below 2019, while condo sales hover near record lows. Supply is ample: single‑family homes have a 4.6‑month inventory and condos 6.5 months. Even modestly lower mortgage rates (~6.37 %) failed to lure buyers; purchase applications are 35 % below 2019.
Price declines are widening. Mid‑tier single‑family home prices are down 10–24 % from their peaks in cities like Oakland, Austin and San Francisco. Condos are even worse, with 23 metro areas seeing 12–28 % drops.
🔗 Tools to explore: Use our Real Estate Investing Calculator to model price drops and rent yields. Stress‑test your purchase with our Margin of Safety Calculator.
📈 Inflation: Distortions Mask Persistent Pressures
Food inflation remains stubborn in certain categories. Beef and veal prices rose 1.2 % MoM and 14.7 % YoY; eggs are still 146 % above mid‑2020 levels. Coffee prices show a huge gap between futures and retail prices.
The Bureau of Labor Statistics reported that Owner’s Equivalent of Rent (OER) increased only 0.13 % MoM—an outlier that suppressed CPI. Without this anomaly, September’s inflation would have looked much hotter. Yet even with the OER distortion, headline CPI grew 0.31 % MoM and 3.01 % YoY.
Our Budgeting Calculator helps project how rising food and housing costs might affect your monthly expenses.
💼 Labour, Debt & Policy
Labour markets show softening conditions. Apartment market tightness eased in Q3 as the NMHC index fell to 31. Hotel occupancy slipped to 68.5 % amid trade‑related travel uncertainty. Jobless claims remain low, but deferred federal resignations will show up in October payroll data.
On the fiscal side, U.S. debt crossed $38 trillion, keeping pressure on long‑term yields. Temporary repo spikes were quelled by banks tapping the Fed’s Standing Repo Facility. Markets expect the Fed to cut rates by 25 bp and halt its balance‑sheet runoff.
🥇 Markets & Metals
Stocks remain elevated despite surging margin debt (up 39 % since April), raising bubble concerns. Gold hit a record above $4.18 k/oz before settling near $4.23 k/oz reuters.com; Bitcoin trades around $115 k, constrained by looming tax reporting rules.
💡 Takeaway
October’s second half continued to reveal a bifurcated economy: housing markets soften despite lower rates, while inflation persists in food and services. Massive debt issuance and looming Fed cuts complicate the outlook. Investors should maintain diversification across cash, real assets like gold, and selective equities, while home buyers may find better opportunities as inventories build.
If you found this update helpful, please share and subscribe to our newsletter. Your support helps us continue providing independent market insights.
What this means for your practice and portfolio
- Financing Costs: The market is anticipating a Fed rate cut. If you are planning a practice acquisition, equipment purchase, or ASC build-out, this is a critical time to model your financing. A small change in rates has a significant impact on the total cost of a project. Use a tool like CenterIQ to analyze the economics before conditions shift.
- Real Estate Opportunities: The data shows a clear softening in the housing market, with notable price drops in major metros. For physicians considering buying their first clinic space or a new investment property, this may present a more favorable entry point. This is the environment that platforms like Repit are designed to navigate.
- Portfolio Strategy: Persistent inflation in some sectors, combined with high valuations in others, underscores the need for a disciplined investment strategy. These conditions test assumptions about long-term growth and retirement timelines. Ensure your approach, whether managed through a platform like Savng or an advisor, accounts for this complex environment.
This information is for educational purposes only and does not constitute investment advice. You are solely responsible for your own financial decisions.
Last reviewed by Pouyan Golshani, MD — 2026-06-23.
Frequently Asked Questions
What is the current state of existing-home sales in 2025?
Existing-home sales in September 2025 showed a slight increase but remain 23% below 2019 levels. Single-family home sales are notably low, with a 4.6-month inventory, while condo sales are near record lows. Despite modestly lower mortgage rates around 6.37%, purchase applications are 35% below 2019 figures. Price declines are significant, with mid-tier single-family home prices down 10-24% in cities like Oakland, Austin, and San Francisco, and condo prices dropping 12-28% in 23 metro areas. The housing market continues to face challenges despite these conditions.
How has inflation impacted housing prices in major cities?
Inflation has significantly influenced housing prices in major cities. Mid-tier single-family home prices have decreased by 10–24% from their peaks in 15 large metropolitan areas, while condo prices in 23 cities have fallen by 12–28%. Despite existing-home sales rising slightly, they remain 23% below 2019 levels, indicating a weak housing market. The inventory for single-family homes is at a 4.6-month supply, and for condos, it is at 6.5 months, contributing to the price declines. Even with mortgage rates around 6.37%, purchase applications are 35% lower than in 2019, reflecting ongoing challenges in the housing sector.
Why are mid-tier single-family home prices declining significantly?
Mid-tier single-family home prices are declining significantly due to several factors. Prices have dropped 10–24% from their peaks in 15 large metropolitan areas, including cities like Oakland, Austin, and San Francisco. Existing-home sales remain 23% below 2019 levels, indicating weak demand. Despite a modest decrease in mortgage rates to approximately 6.37%, purchase applications are 35% below 2019 figures, reflecting buyer hesitance. Additionally, ample housing supply, with single-family homes having a 4.6-month inventory, contributes to the downward pressure on prices.
Reviewed by Pouyan Golshani, MD, Interventional Radiologist — August 4, 2026