
Stock research that translates corporate billions into hours of your clinical work.
A surging tech stock looks like opportunity. Your gut says buy before it's too late. But excitement isn't data, and your time is too expensive to spend reading 10-Ks. Savng is the behavioral reality check designed for physicians who earn well, work long hours, and don't have time to be wrong about money.
Reverse DCF · insider activity · short-seller signals · bankruptcy screens · historical anchors — and a translation layer that converts abstract corporate metrics into RVUs, so you know exactly how many clinical hours a stock is asking you to bet.
Where physician investing breaks down
You earn well. You're analytical. You also work 60-hour weeks and don't have time to model cash flows the way a hedge-fund analyst does. The result is the same three failure modes — over and over.
The breakroom hype trade
Apple's surging. Nvidia's at an all-time high. The fellow next to you doubled their money on a name you'd never heard of. Your gut says buy. But you have no way to measure whether you're buying the top of a speculative bubble — until the bill comes due.
The standalone-number problem
Yahoo Finance shows P/E. Bloomberg shows DCF. Neither tells you what those numbers mean. Is a 25% growth expectation reasonable for Apple? Is a P/E of 18 cheap or expensive for a regional bank? A single metric without context is just noise dressed up as analysis.
The value trap
A cheap stock can always get cheaper. A 50%-off business with a structurally broken balance sheet drops another 50%, and another. Most amateur deep-value investors learn this the expensive way — by buying ten Sears Holdings for every one Apple-in-2003.
What Savng shows you on every stock
Open a ticker. Savng returns five lenses, each designed to answer a question a busy physician-investor actually has — not a Goldman analyst.
What is the market actually betting on?
Traditional DCF guesses what a stock is worth. Reverse DCF tells you what's already baked into the price. At Apple's $312, Savng reveals the market is pricing in 21.1% annual cash-flow growth for a decade — a top-decile historical outcome for a $4.5T company. Tweak the discount rate, plot multiple valuation models side-by-side on a football-field chart, and know exactly what you're betting on.
See a reverse DCF →Who's selling — and who's betting against it?
Valuation doesn't move a hyped stock — behavior does. Savng pulls insider open-market buys and sells from SEC Form 4, alongside short interest and days-to-cover from FINRA. Net insider activity (excluding grants and tax withholding) and short-seller positioning together are the leading cracks before a narrative breaks.
See insider data →Is this growth even physically possible?
What does the price require? Savng benchmarks the required trajectory against historical legends — Nvidia in 2015, Amazon in 1999, the post-bubble compounders. If a $4T company has to grow like a $40B company did, you'll see it side-by-side instead of having to imagine it.
See the anchors view →Is this a bargain or a value trap?
Cross-references Altman Z-Score (bankruptcy risk) and Piotroski F-Score (operational quality) with traditional DCF. A cheap company backed by improving cash flow looks one way; a cheap company on the bankruptcy slope looks another. Two screens, ten seconds, no more learning the difference the expensive way.
See a Z/F-score check →The right model for the right business
Banks don't trade on DCF — they trade on book value, ROE, and ROA. Savng's bank lens drops you into Price/Book vs. Return on Equity in plain English: "You're paying $2.30 for every $1 of equity, and equity earns 15.4% — that's the strong-bank zone." Other sectors get their own lens too: REITs, insurers, energy, biotech.
See the bank lens →
Who's selling — and who's betting against it. Insider activity (SEC Form 4, open-market trades only) and short interest (FINRA Reg SHO) — the behavioral signals that move hyped stocks before the narrative does.
The translation layer no other stock tool has.
Every other research site shows you "Operating Cash Flow of $111.5B." Numbers like that don't connect to anything in your life. They're abstract.
One click and Savng anchors the cost or value of any stock — or any cash-flow metric — to something you tangibly understand: your own clinical labor and time. A $50,000 position becomes "≈ 215 wRVUs at the national average rate." Apple's annual buyback becomes "the lifetime output of 71,000 cardiologists." Numbers stop being abstract. Decisions get easier.
Built because the founder is a practicing interventional radiologist, not a finance person who guessed at what physicians need.
Which investor are you?
Savng's three persona profiles surface the lens that matters most for how you actually decide. Pick the one that sounds like you — the filtering follows.
Excited by the rally? Reality-check it first.
You read the news, hear the FOMO, want to ride the wave. Savng leads with Smart Money & Shorts: insiders, short interest, and historical anchors. Before you buy the top, you'll see whether the people closest to the company are quietly selling into your enthusiasm.
Like math? Reverse DCF is your home base.
You want to know what the market is implying — not what some analyst guesses. Savng's Reverse DCF, football-field chart, and what-if sliders turn the math into an interactive thesis. You're not staring at one P/E — you're seeing the full range of plausible outcomes.
Hunting bargains? Avoid the structural traps.
You believe in buying businesses below replacement cost. Savng's value-trap filter runs Altman Z and Piotroski F alongside DCF, so the deep-discount names you're considering get a structural quality check. Cheap is great; cheap-and-going-bankrupt isn't.
Not every business trades on DCF.
Banks don't. REITs don't. Insurers don't. Savng surfaces the right valuation lens for the business model — in plain English.
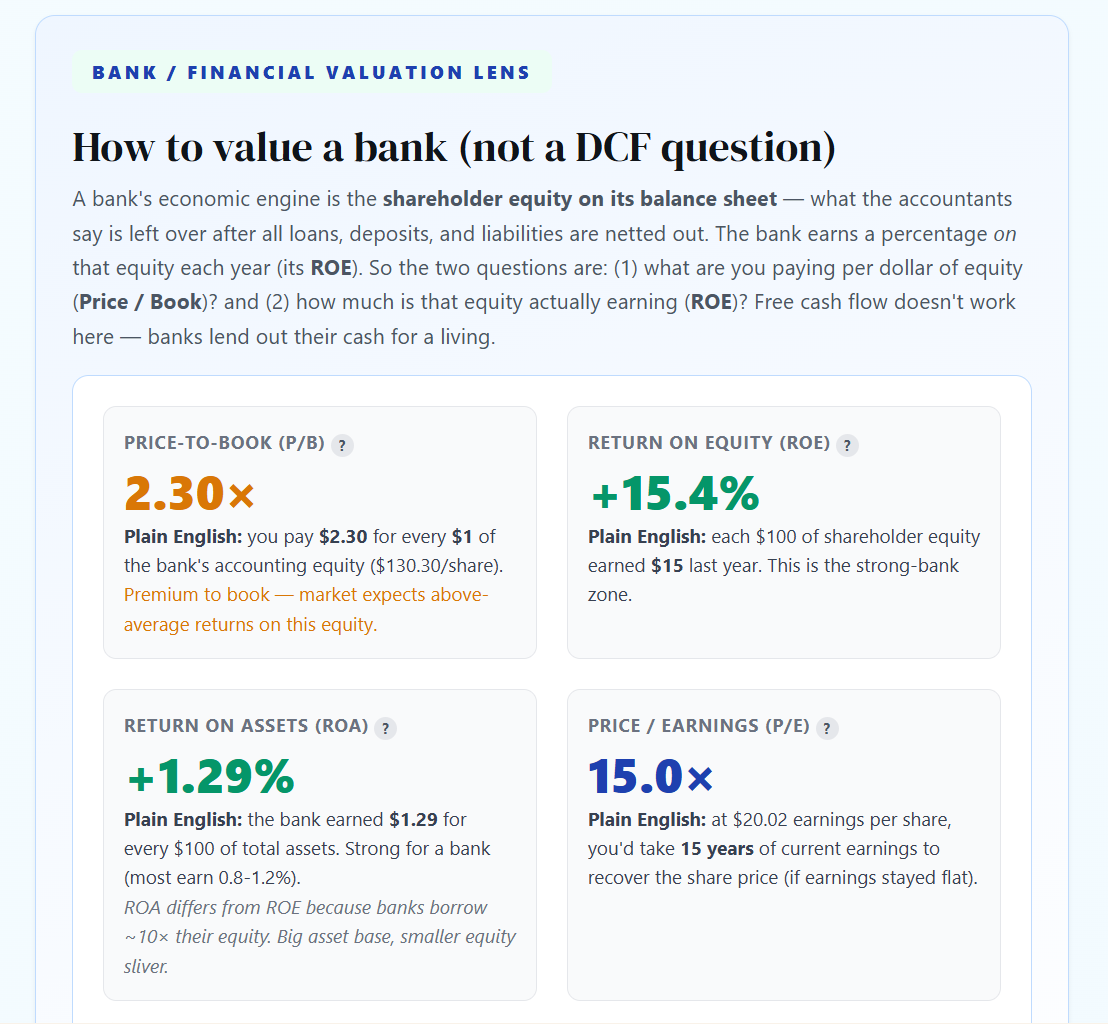
Bank / financial valuation lens. Price-to-Book, ROE, ROA, P/E — the four numbers a bank actually trades on, each with a plain-English explainer so the lens fits the business, not the other way around.
Built for time-constrained earners who want to be wrong less often.
Savng wasn't built for hedge fund analysts. It was built for the people who need this stuff most — and have the least time to figure it out alone.
Earn in the top 5%. Invest with the discipline of the top 1%.
If your W-2 is bigger than the median fund's gross management fee, you can't afford to outsource thinking. Savng is the read-it-between-cases tool that gives you institutional-grade signals in 90 seconds per ticker.
Get the discipline before you have the money.
Most physicians learn to invest after they're already making attending money — which means learning expensive lessons with expensive capital. Savng is free during beta and will stay free for residents and fellows long-term. Build the framework now.
Same earnings profile, same time crunch.
Savng's frame is built around physicians, but the failure modes are universal to high-W-2 professionals. The RVU translation has analogs (billable hours, project rates) — and the Reverse DCF / Smart Money / Bankruptcy screens apply to every public stock regardless of who's reading.
Allocate practice cash flow with the same rigor as the practice itself.
If you've built an ASC, OBL, or imaging center, you already understand fundamental valuation viscerally. Savng applies the same business-quality lens to your public-market portfolio — and integrates with GigHz Capital and CenterIQ for the rest of your balance sheet.
Common questions
Is Savng giving me investment advice?
No. Savng is an educational research tool. It surfaces public data (SEC filings, FINRA short interest, market prices) and well-known quantitative models (DCF, reverse DCF, Altman Z, Piotroski F) in a clearer interface. It does not recommend buying or selling any security. Investment decisions are yours.
Where does the data come from?
Insider buys and sells are pulled from SEC Form 4 (open-market trades only — grants, option exercises, and tax-withholding sales are excluded so the signal stays meaningful). Short interest comes from FINRA Reg SHO (bi-monthly) and Nasdaq daily short-volume reports. Price and fundamentals are from public financial-data providers.
What does the RVU translation actually do?
Toggle it on, and any dollar figure in the app — a market cap, a buyback authorization, a position size — gets a parenthetical translation into work-RVU equivalents at the current national average reimbursement. The mental anchor is concrete: not "$50,000" but "~215 wRVUs of your time."
How much does it cost?
Free during beta. Free for residents and fellows long-term. A paid tier for attendings is on the roadmap once the core feature set is locked — pricing not yet finalized. If you want early access while it's free, just go to savng.com.
Does this integrate with the rest of GigHz?
Yes. Savng's RVU translation uses the same physician-finance data layer that powers the Physician Finance Hub. Practice owners can cross-reference public-market analyses with CenterIQ (for ASC/OBL valuation) and GigHz Capital (for real estate). One worldview across your full balance sheet.
Who built it?
Pouyan Golshani, MD — a practicing interventional radiologist — and the GigHz team. Built because the founder kept losing time hand-running Reverse DCFs between cases and couldn't find a tool that translated corporate finance into physician-readable terms.
Before you chase the next rally, run it through Savng.
Free during beta. Free for residents and fellows long-term. No account required to start.
Savng provides research, education, and quantitative signals derived from public data. It is not investment advice, and no recommendation to buy or sell any security is given. Past performance does not predict future results. A GigHz product. Built by Pouyan Golshani, MD.
Written and reviewed by Pouyan Golshani, MD, Interventional Radiologist — Last updated June 2, 2026