
2026 Landlord Exodus & Housing Stress Index
Verified Data Analysis • January 2026
TL;DR — Key Findings
Executive Summary
For the first time since the 2008 financial crisis the U.S. housing market is fragmenting into clear winners and losers. Analyzing Zillow home-value and rent data, state landlord-tenant statutes, and proprietary affordability metrics, we find that:
- 32% of U.S. metros are in year-over-year price decline and 13 states remain below their 2022 peak. Florida, Texas, Arizona and California lead this correction.
- Rent growth has collapsed from double-digit surges to low single-digits across much of the country. Florida's rent growth fell from 23.9% in 2021 to 1.2% in 2025; Arizona from 21.0% to 1.8%; Utah from 17.7% to 1.4%; Hawaii from 21.6% to 3.2%.
- Affordability is deteriorating rapidly. Hawaii now requires a median household income of $122,828 just to rent the typical home, and it takes 17 years for a median household there to save a 20% down payment.
- Seller desperation is spreading. In Florida 76% of homes sell below list price, 29 percentage points higher than in 2022. Colorado's for-sale housing inventory has surged by about 176% since early 2022.
- Policy friction matters. States with low landlord-friendliness ratings have the highest rent burdens. The median renter in those states spends more than 27% of income on rent versus 22% in landlord-friendly states.
- Crash risk is highly concentrated. Our Crash Risk Index assigns each metro a 0–10 score. Four Florida metros plus Sevierville, TN earn a perfect 10/10. Austin, TX scores 9/10 after a 23.6% drop from its 2022 peak.
- Some markets remain remarkably resilient. Rockford, IL; Erie, PA; Utica, NY; St. Joseph, MO; Janesville, WI; Canton, OH; Syracuse, NY; Cleveland, OH score 0/10. Midwest markets dominate this list.
- Tenant-friendly policies correlate with higher rent stress. The six least landlord-friendly jurisdictions average 21.0% rent stress, while the most friendly states average 18.3% — a 2.7 percentage-point gap.
The full index classifies every state into one of four capital zones based on landlord friendliness and rent stress. Investors are already voting with their dollars — capital is flowing out of the least friendly, most stressed states and into the Southeast, Midwest and Mountain West.
Methodology
This report synthesizes multiple data sources:
- Zillow Home Value Index (ZHVI) and Zillow Observed Rent Index (ZORI) for 894 metropolitan areas and all 50 states. We use the seasonally adjusted, smoothed ZORI series to remove noise and seasonality.
- State landlord-tenant statutes, compiled into a Landlord Friendliness Index (1 = least friendly, 5 = most friendly). The index scores eviction speed, rent control laws, deposit caps, late-fee rules, lease-termination notices and entry requirements.
- Affordability metrics including income required to rent, years to save for a down payment, and rent-to-income ratios.
- Seller behavior measures such as the share of homes selling below list price, change in days-to-pending, and inventory growth since January 2022.
States are assigned to one of four quadrants — Investor Magnet, Volatile Opportunity, Flight State or Stable Low-Growth — based on their combination of landlord-friendliness and rent stress.
The Landlord Friendliness Divide
The Landlord Friendliness Index reveals a sharp divide between states that encourage housing investment and those that hinder it. States such as Texas, Florida, Alabama and Indiana earn the maximum rating of 5. At the other end, California, New York, New Jersey, Massachusetts, Washington and D.C. rate 1.
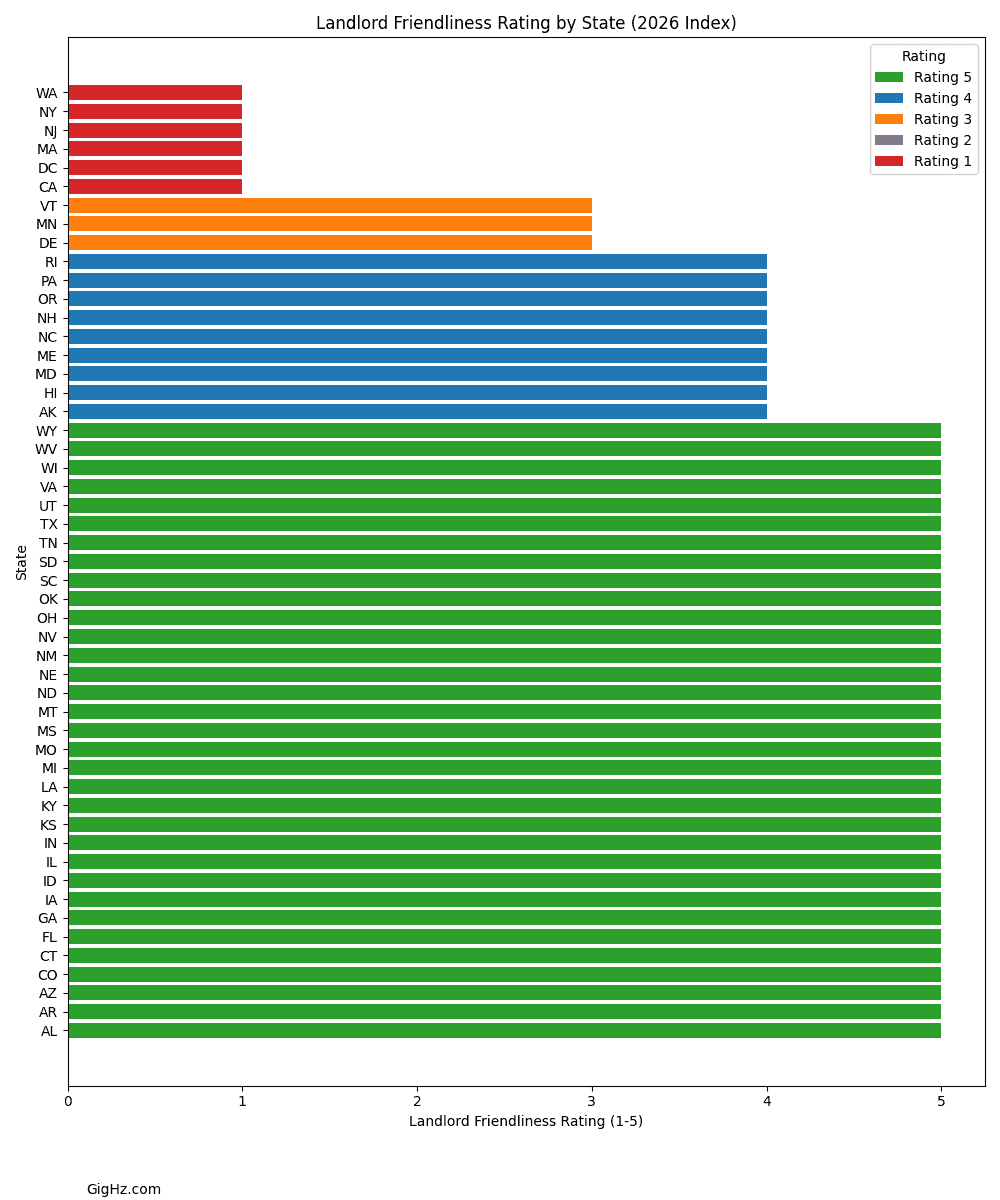
Landlord Friendliness Index by state (1 = least friendly, 5 = most friendly) — Click to enlarge
While over half of U.S. states still score 5, investors are increasingly aware of the risk of regulatory drift. For example, Washington enacted statewide rent caps in 2024 and just-cause eviction rules earlier, pushing it into the lowest tier.
Rent Stress and Affordability
Rent stress — defined as the percentage of household income spent on renting — has emerged as the clearest signal of social and political pressure. The median U.S. renter spends 23% of household income on rent, but the burden exceeds 30% in many coastal states.

Rent burden vs. landlord friendliness by state, colored by capital zone quadrant — Click to enlarge
Massachusetts presents a striking outlier: despite banning rent control by ballot initiative in 1994, it has the nation's highest low-income rent burden at 68.4% — suggesting that other tenant protections may produce similar effects.
The Rent Cliff
After peaking in 2021, rent growth has rapidly decelerated. The steepest decelerations occurred in states that saw huge surges during the pandemic (Florida, Arizona, Utah) and in heavily regulated markets where supply can't adjust quickly.

Year-over-year rent growth by state (negative = declining rents) — Click to enlarge
Price Cut Panic
Seller behavior provides another lens into shifting market conditions. The share of homes selling below list price has exploded in several states, signaling seller desperation unseen since the Great Financial Crisis.

Percentage of homes selling below list price by state — Click to enlarge
Years to Save: The Affordability Collapse
For would-be homeowners the hurdle is no longer just high prices but time. Hawaii tops the list at 17.1 years, with California at 13.2 years and Nevada at 12.4 years. States in the Midwest and South require fewer than six years.

Years required to save a 20% down payment by state — Click to enlarge
The Four-Quadrant Investor Model
By plotting landlord friendliness against rent stress we identify four distinct capital zones:
| Quadrant | Characteristics | Representative States | Implications |
|---|---|---|---|
| Investor Magnet | High friendliness, low rent stress | Indiana, Iowa, Kansas, Alabama, Georgia | Stable cash flow and policy predictability attract investors. |
| Volatile Opportunity | High friendliness, high rent stress | Florida, Texas, Arizona, Tennessee | Opportunities but risk of political backlash. |
| Flight State | Low friendliness, high rent stress | CA, NY, NJ, MA, WA, D.C. | Investors and landlords exit these markets. |
| Stable Low-Growth | Low friendliness, low rent stress | Minnesota | High regulatory burden limits upside. |
Migration Patterns and 2026 Outlook
Capital does not migrate in isolation; people move with it. Census data show continued outbound flows from the coastal Flight States to the Southeast and Mountain West. We expect this pattern to persist into 2026 because:
- Policy divergence will widen. Pressure from rent-burdened tenants will lead to more rent caps and just-cause eviction laws.
- Affordability ceilings will constrain demand. Even small mortgage rate increases trigger outsized demand destruction in expensive markets.
- Supply expansions will concentrate in friendly states. Permit issuance is rising fastest in Texas, Florida and the Carolinas.
Metro Snapshots & Top Lists
State-level analysis exposes broad divergences, but real estate remains intensely local. We analyzed 15 major metropolitan areas across the West Coast, South, Mountain West, Midwest and Northeast.
West Coast
- Los Angeles–Long Beach–Anaheim: Median home value ~$943k; 9% above 2022 peak yet rent stress at 34.6%. Half of homes sell below list price.
- San Diego–Carlsbad: $918k median value (+2.7% from peak), rent stress 31%; nearly 55% of homes sell below list.
- San Francisco–Oakland–Berkeley: $1.10M median value (8% below peak), rent stress 26.2%; inventory up 85%.
- Seattle–Tacoma–Bellevue: $733k median value (7% below peak), rent stress 22.7%; inventory up 168%.
- Portland–Vancouver–Hillsboro: $541k median, rent stress 21%; landlord rating 4/5, gross rent yield 4.08%.
South & Mountain West
- Phoenix–Mesa–Chandler: $444k median (7% below peak), rents declining (−0.4%), gross rent yield 4.76%.
- Las Vegas–Henderson–Paradise: $430k median (0% below peak), rent stress 24.9%; gross rent yield 4.87%.
- Dallas–Fort Worth–Arlington: $361k median (6% below peak), rent stress 20.6%; gross rent yield 5.57%.
- Austin–Round Rock–Georgetown: $426k median (23.6% below peak — worst among major metros), 74% of homes sell below list price, 72 days to pending.
- Houston–The Woodlands–Sugar Land: $305k median (7% below peak), gross rent yield 6.48%; 68% of homes sell below list.
- Miami–Fort Lauderdale–Pompano Beach: $471k median (7% above peak), rent stress 47.3% — highest among 15 metros; 80.2% of homes sell below list.
- Atlanta–Sandy Springs–Alpharetta: $378k median (+0.2% from peak), rent stress 23%; 64% sell below list.
Northeast & Midwest
- New York–Newark–Jersey City: $704k median (3% above peak), rent stress 38.9%; inventory 8% lower than January 2022.
- Boston–Cambridge–Newton: $715k median (9% above peak), rent stress 28.2%; days-to-pending just 16 days — fastest among metros.
- Chicago–Naperville–Elgin: $337k median (12.6% above peak), rent stress 26.3%; gross rent yield 7.41% — highest among metros.
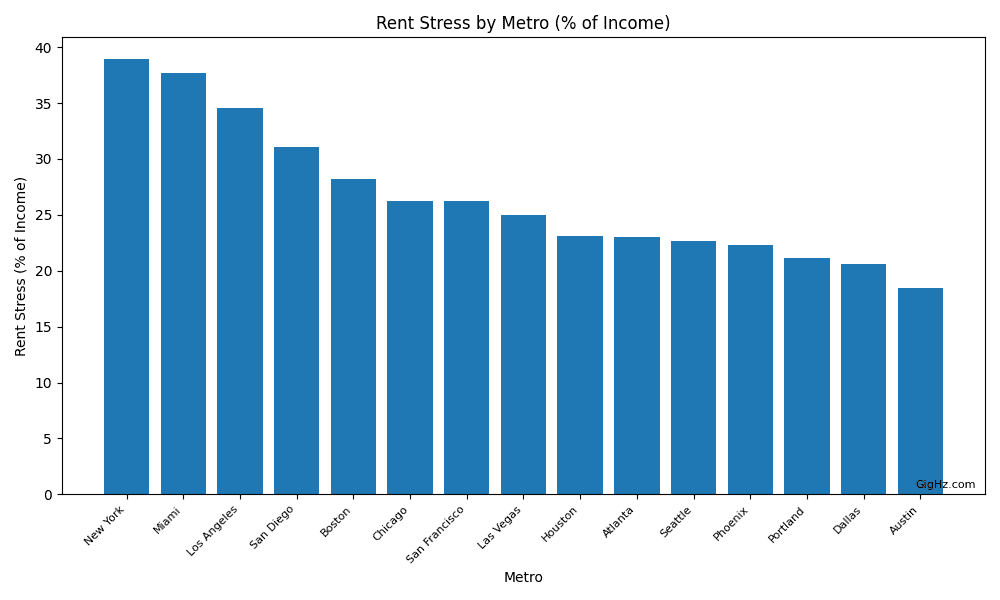
Rent stress by major metro area — Click to enlarge

Percentage of homes sold below list price by major metro — Click to enlarge

Gross rent yield by major metro area — Click to enlarge
Top 10 Lists
From the full Zillow metro database (894 metros) we compiled a series of Top 10 lists. Highlights include:
- Most rent-stressed cities: New York, Santa Maria, Miami, Kahului and Los Angeles — more than 34% of income on housing.
- Cities where price cuts are surging: Naples, Key West and several Florida markets — more than 80% below list price.
- Worst price declines: Punta Gorda (−12.9% YoY) and Murray (−12.3%).
- Furthest below 2022 peak: Austin remains 23.6% below its pandemic high.
- Slowest markets: Key West, Del Rio and Cullowhee — more than 90 days to go pending.
- Highest crash risk: Naples, Punta Gorda, North Port, Cape Coral, Sevierville — all 10/10. Austin 9/10, Miami 8/10.
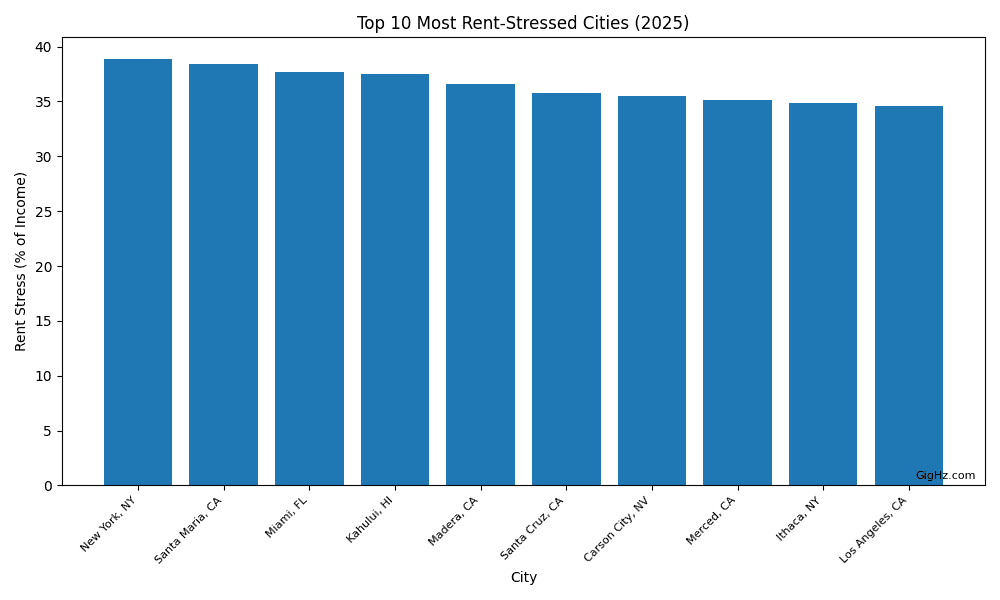
Top 10 most rent-stressed metropolitan areas — Click to enlarge

Crash Risk Index scores by metropolitan area — Click to enlarge

Crash Risk Index detailed breakdown — Click to enlarge
Expert Commentary
"We're measuring the incentives embedded in state housing policy. Investors and landlords aren't villains or heroes; they're actors responding rationally to regulation, supply and affordability. If policymakers want different outcomes, they need to change the incentive structure."
Dr. Pouyan Golshani, MD — Founder, GigHz
"We're building a national real-estate data-farm and API that will spotlight market hotspots across the U.S. and deliver AI-driven property picks for cash flow or appreciation. It's updated monthly and informs every real-estate decision we make."
Dr. Pouyan Golshani, MD — Founder, GigHz
Correlation vs Causation
Rent control/caps may be adopted in places where rents were already high. This analysis measures outcomes, not intent.
Whether rent control causes higher burden or merely correlates with it, the affordability goal isn't being achieved for low-income households in these markets — and the gap (42.1% vs 29.1%) exists regardless of causation.
Limitations
- ZIP-level averages can hide within-ZIP variation.
- "Policy environment" categories simplify complex local rules.
- Market outcomes are multi-factorial (supply, insurance, migration, income mix).
Conclusion and Next Steps
The 2026 Landlord Exodus & Housing Stress Index demonstrates that the U.S. housing market is splitting into distinct capital zones. States combining landlord-friendly rules with moderate rent stress continue to attract investment and migrants, while those layering regulation onto already stressed tenants are losing both.
If you would like a personalized analysis of how these trends affect your portfolio or wish to access the ZIP-level datasets behind this report, contact us at GigHz.com.
About GigHz
GigHz is a research and capital platform founded by Dr. Pouyan Golshani, an interventional radiologist and serial entrepreneur. Dr. Golshani performs image-guided procedures — cancer ablations, embolization, spine and pulmonary interventions — while building technology companies that solve problems he encounters in practice and investing.
GigHz operates several ventures:
Repit.org — A real estate intelligence platform that aggregates Zillow, HUD, Census, and proprietary data to help investors and homebuyers make data-driven decisions at the ZIP level.
GigHz Precision AI — An agentic radiology reporting engine that streamlines physician documentation.
GigHz Capital — Investment advisory and deal sourcing for physicians, founders, and high-income professionals.
Website: gighz.com · Media inquiries: [email protected]
Written and reviewed by Pouyan Golshani, MD, Interventional Radiologist — Last updated January 3, 2026